Asked how tree crop enthusiasts are keeping track of plantings and related info, I shared this info:
Metal tree tags on locust stakes are low-tech and work reliably. Next best is grease-pen or indentations on metal or vynil tags, attached to trees themselves. Overall, it’s great to be pro at plant ID, but that doesn’t always work to differentiate between cultivars.
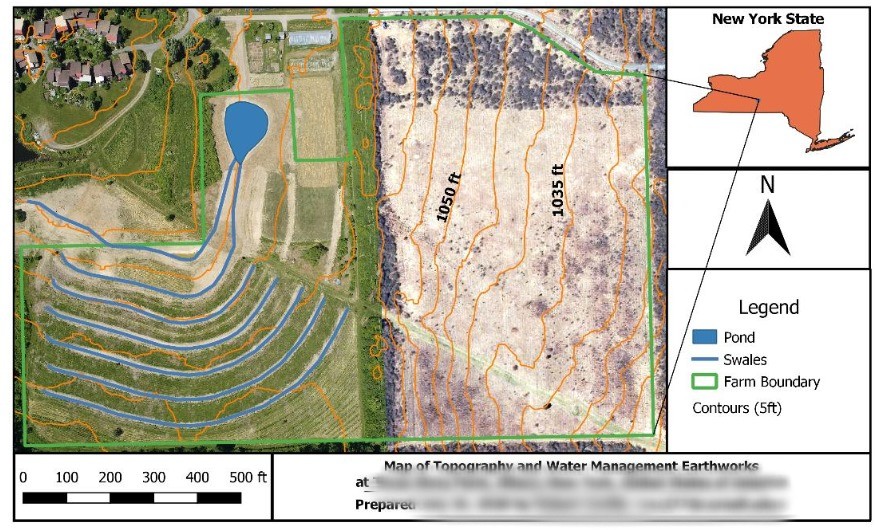
For a more advanced, digital approach, I use QGIS. It offers the benefits described in a comment above about ArcMap, but it is free and open-source software. It has a little bit of a learning curve, but it is a very powerful tool and it can interface with other geospatial technology including GPS, Google Earth, and iNaturalist. Google Earth has an easier learning curve and has more than enough features for most users. If you want to go the QGIS route, I recommend trying the following steps to begin with, and feel free to ask questions in the comments or on gis.stackexchange.com.
- Install (and if you can, make a contribution to) QGIS https://www.qgis.org/en/site/.
- Find and download raster files (.jpg, .tif) for overhead views of your Area of Interest (AOI). These files are referred to as aerial imagery or orthoimagery, and in the U.S. you can get them from county GIS websites or from https://nationalmap.gov.
- Follow a basic tutorial about raster vs. vector file types, and creating shapefiles.
- Create a polygon shapefile for your AOI boundary- Create a point shapefile for your individual plants.
- Add new attribute fields to your ‘plant points’ shapefile to describe characteristics you want to keep track of. Here’s some fields I use (+ examples/explanation):
- species (corylus spp.),
- planted_date (fall 2019),
- permanent (y/n in case it is to be transplanted),
- measured (y/n to indicate if its location is precise or estimated),
- source (to keep track of cultivars, purchases, etc),
- updated (date for when this entry was last updated, since inevitably the records can get out of date; update this every time you update any other field for this data row)
- notes (misc info that doesn’t fit cleanly in other fields, try to use this sparingly as it is better to have distinct fields in case later on you want to select or analyze plants based on some attribute)
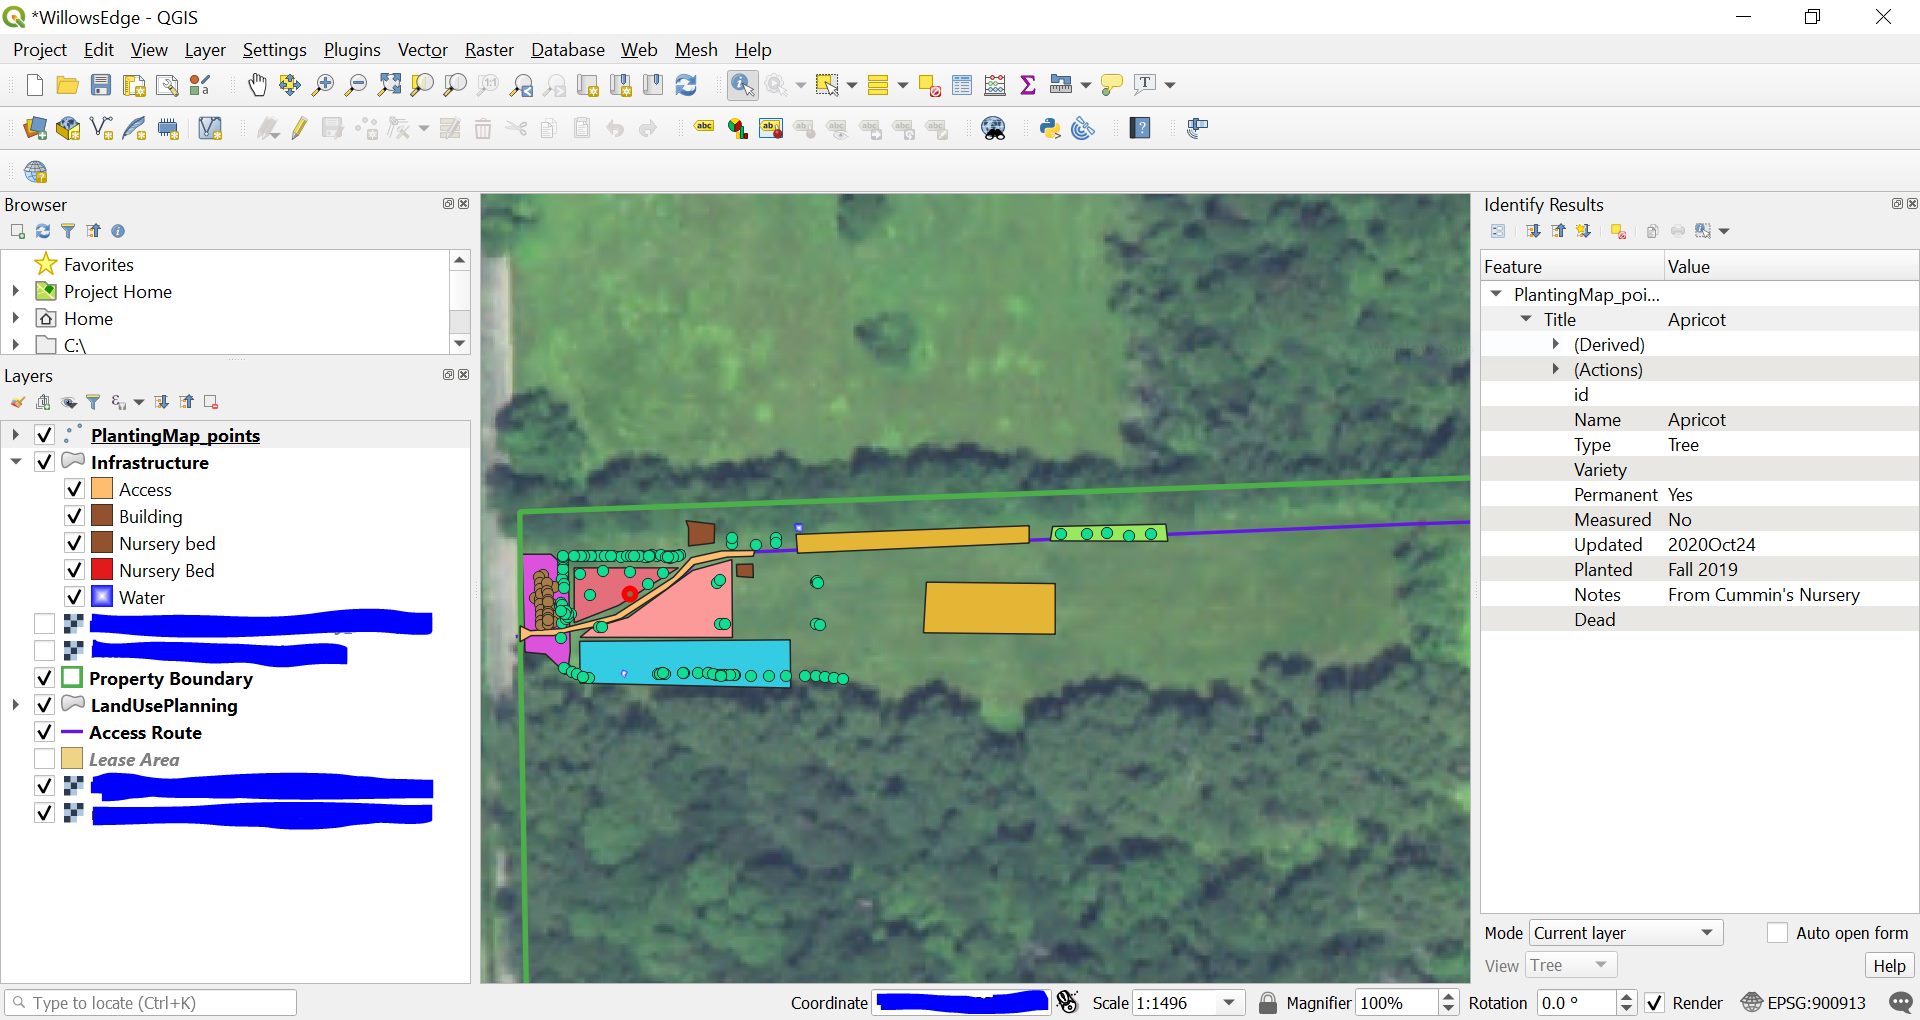
At this stage, you will have a powerful, interactive map of your AOI, with individual points or polygons to depict features of interest on your property, and those features can have a miniature (or massive) database of characteristics associated with them. You can have as many or as few fields as you’d like, and you can even associate fields (e.g. feature_ID) with other datasets, such as yield records or amendment history for an orchard block.
In practice, as I plant or inspect plantings, I jot notes in text messages to myself or on a muddy piece of paper, and then I digitize those notes by updating my QGIS project for the plantings. A text might be as cryptic as “purp os willow x4 3′ e of ne hazels” and I use those notes to enter four purple osier willows planted at 3-foot spacing starting east of the northeast hazelnut hedge. As long as I don’t wait too long between field notes and digitizing, it works well enough, and this could be much more precise if I wanted to take the time to GPS-locate each planting.
Lastly, if you are just getting started with GIS tools, I suggest exploring a basic tutorial about Coordinate Reference Systems (CRS) and about Georeferencing. That will help you get ahead of GIS software’s more confusing aspects, which many people don’t learn about until they are tangled in problems with coordinate systems. Using a CRS appropriate for your region and consistent for all layers in your project will help you avoid problems and make accurate spatial measurements and maps. Again feel free to drop questions in comments or visit the very helpful gis.stackexchange.com.